
Introduction
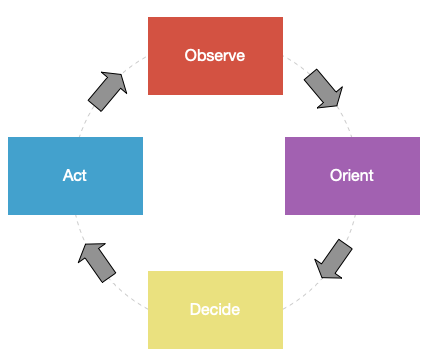
Col John Boyd developed the OODA loop (Observe-Orient-Decide-Act) as a decision making concept for use within military operations. Agility and the ability to rapidly iterate through the loop and through multiple iterations of the loop is consider a winning advantage in conflict. A stereotypical example of the ‘dogfight’ where the fighter pilot that ‘gets inside’ the other’s OODA loop wins the day. The OODA loop is applicable in areas where agile operations lead to better results.
What does it mean to Observe?
The Observe stage is the first part of an iteration of this loop and within a larger consideration of the OODA loops lets consider what Observe means.
In a non trivial system, it will have internal state (which is not visible outside the system boundary), the system will also have external outputs which are visible outside the system boundary. Observability is a measure of the (invisible internal system state) can be derived from the ability to measure its external outputs.
To Observe is defined as – ‘to regard with attention, especially so as to see or learn something’ which aligns with the concepts of measurement of external outputs(regard with attention) to derive internal state (learn something).
Monitoring versus Observabilty
Monitoring is another term that appears in this space. Monitoring is similar but different to Observability. Both Monitoring and Observability are measuring the external outputs of a system. Examples of system outputs that would be measured in an Enterprise software, SaaS or cloud system include:
- Events emitted by the system.
- Log files generated by the system
- measurements or metrics of the system – response and reaction times, load and resource consumption metrics, activity metrics.
Observability differs from Monitoring in their end goals. Monitoring uses the external measurements or signals of the system to indicate that a problem is or has occurred. Observability on the other hand also using the external measurments to understand the internal state of the system as it exists in this problem state and offer pathways to resolve the problem situation. Observability attempts to identify the root cause of the issue which has caused the system enter this problem state. With the root cause in hand remediation of this problem state can then begin whereas Monitoring will only indicate that the (unseen) problem state exists based on the external measurement artifacts. Monitoring by itself will not offer a pathway to this problem state resolution.
Observability can be considered to be a superset of Monitoring both in terms of the items that it processes and also its objectives. As noted Monitoring attempt to indicate that a problem is or has occurred while Observability goes on to attempt to diagnose and aid in the remediation of this situation.
Metrics are a key source of measurement data in both processes and with metrics there are a number of key metrics that provide a foundational model of the state/operation of the system under consideration, these key metrics are:
- Traffic (or Activity), this metric can appear as queries per second, requests per second, interactions per second all of which are a measurement of the interactivity of the system with external entities.
- Latency – this is a measurement of the responsiveness of a service request that the system is responding to. Fundamentally it is the time that the system takes to respond and complete a request. The latency figures for service requests may indicate that the system is degrading (slow grinding to a halt). It is important to note that one must differentiate between the latency of successful and failed requests, a request that is failing may fail immediately ( giving a very low latency number – so its looks like a fast response to the query) but a failed request latency figure may not be a true representation of the operating or service state of the system. The latency measurements of a successfully served request will provide a information regarding the oeprating/service state of the system, particularly is the latency numbers are outside the normal operating range or are increasing over the a period of time.
- Error — The error rate or types of errors that are measured and provided as metrics both also provide valuable views into the system operation and its interaction with external entities.
- Resource Utilization — and particularly saturation of resource utilization within a system provides an information view point into the operating state of the system. Having a keen understanding of resource utilization during proper operation of the system as well as the ability to track deviations of the resource utilization provides good data with which to understand the system operation. One point worth noting is that an increase in resource utilization away from the baseline measurement may not indicate a problem state but may just be a true indicator that the system is doing more work or offering more service. If a system was operating at baseline resource utilization where it is serving 100 transactions per some unit of time, a resource utilization increase of 10% may not be an issue particularly if the system is designed with headroom where there is still a significant amount of unused or available resources left. This 10% increase in utilization may be a result in a 10% increase in the number of transactions its processing per unit of time. If there is not increase in Traffic then this increase in resource utilization may be an early indicator in a change in operating state of the system.
Logs and Events provide a temporal record of the operation and processing that is happening in a System. Log and Events may be processed to understand and reconstruct threads of activity as recorded by the events and logs. In addition to logs Tracing capabilities may be available within the system to allow for a abstract tree of operations to be recorded as the system interacts with the external world. Traces may be independently created by various sub-systems within the greater system and through either unique transaction or workflow identifiers that appear in the various trace streams or through correlation of different identifies a transaction level view of activity can be built. These transaction views allow for a clearer understanding of the internal operation and state transitions of the system and thus provide valuable input to analysis capabilities that further the Observability goals.