Autonomous Driving, How the driverless revolution will change the world

Autonomous Driving, how the driver less revolution will change the world by Hermann, Brenner and Stadler provides comprehensive coverage of the revolution in mobility that is leading towards to goal of achieving autonomy in driving. Its worth noting that Autonomy is focused on the autonomy of the computer system and associated cloud entities and that systems ability to operate, control/drive a vehicle. Existing 20th century vehicles were already autonomous driving vehicles with the human driver being the entity experiencing autonomy.

Structure

The book provides significant coverage over 400+ pages, divided into 39 chapters across 10 parts. The main parts of the book are:

  • Evolution and Revolutions in Mobility
  • Perspectives on Autonomous Driving
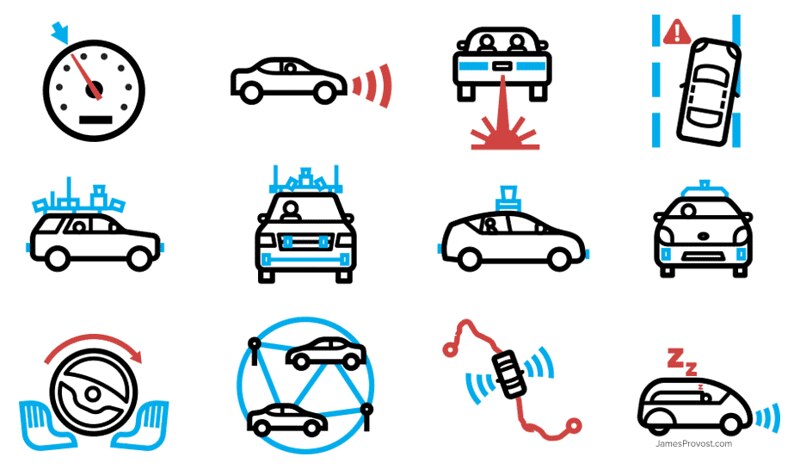
  • Technology of Autonomous Driving
  • Arena of Autonomous Driving
  • Customers and their mobility behavior
  • Framework and conditions for Autonomous driving
  • Impact on vehicles
  • Impact on companies
  • Impact on Society
  • What needs to be done.

Automated driving versus Autonomous driving

Automated driving is an umbrella term that described an evolution of capabilities and functionality that begins with driver assistance systems. Autonomous driving describes an end state where the system takes over all steering, breaking, accelerating control. It achieves a level of functionality where it takes the person ‘out of the loop’ and the car is operating independently at all times and in all traffic situations.

The capabilities along this spectrum is clearly laid out using a set of levels:

  • 0: This is the starting point, no automation, the driver is in complete control of the vehicle without any system suopport.
  • Level 1 and 2: The system takes responsibility for more of the driving tasks but the driver is obliged to permanently monitor the system, the traffic and it operating environment. In these levels the driver must be able to take over the driving function at any time.
  • 3: is a state where the driver no longer needs to monitor the driving activity continuously, with the system indicating when its necessary to take control of the vehicle.
  • 4: is a state where the driver has the capability to undertake all the driving functions in the normal operating environment but the drive can overrule or take over the operation of the vehicle.
  • 5: is true autonomy where the system is always in control and the driver is now just a passenger. As a passenger, they cannot influence the operation of the vehicle in terms of control. The person, of course, still indicates parameters such as destination and traveling parameters (tolls/no tolls, take the scenic route etc.)

State of Art in Autonomous Driving

Autonomous driving is no longer science fiction. There are self-driving vehicles currently operating, some in normal traffic and some in controlled environments. As the developers and operators of these systems gain experience they are expanding the roles, locations and available capabilities that are being deployed into ‘the wild’.

A number of mobility use cases are enabled through autonomy. This may result in different types of self cars reaching the market:

  • Robo cars,
  • Busses
  • and multi-purpose vehicles.

Although Autonomy is coming to the car and it is evolving into being part of a new (‘Disrupted’) ecosystem. This offers a wide variety of connected services and mobility solutions including operating in conjunction with other modes of transportation.

Autonomy and social benefits.

Currently world wide there are over 1.25 million deaths and over 50 million injuries that are associated with traffic collisions. This is a significant cost to society both in terms of human costs but also health and safety associated costs. It is estimated that way over 90% of traffic collisions can be attributed to human error. With the worldwide adoption of autonomous driving technologies and associated mobility use cases there is significant opportunities for reducing the costs to society and turning autonomy into a social benefit.

It is estimated in the US that traffic accidents and the associated repairs, hospitalization, rehabilitation and other such costs amounts to $500 billion per year. Autonomy use cases that significant reduce traffic related death, injury and damage will have a significant impact on this very significant financial cost.

Trends in Mobility.

Autonomy and mobility are closely intertwined with a number of other trends and areas that are very prominent in the 21st century, these include:

  • Connectivity.
  • Urbanization.
  • Sustainability.
  • Electrification.
  • Sharing.

Life in the 21st century is embracing and driving massive changes throughout these areas, all these trends promote autonomous mobility and mobility use cases contribute positively to the acceleration of growth and adoption of these trends.

Openmined – opportunity and distruption of privacy infrastructure.

I recently became aware of openmined and its open-source community work to make privacy-preservation available through the world by lowering the barrier to entry to a number of technologies that support and solve the privacy/transparency tradeoff.

To learn more about openmined goals, messages and approach I have undertaken their “Our Privacy Opportunity” course which is a 7 hour, video led introduction and discussion of the privacy and more specifically issues around the privacy/transparency tradeoff which is a key aspect of the information world in which we all operate in the 21st century.

The course is a free course, with a syllabus that incrementally introduces a set of concepts that build a key understanding of the underlying basic issues (and opportunities of privacy) that are scattered throughout modern life.

Information Flow, the Privacy and Transparency dilemmas.

The course starts by clearly defining what is an information flow as its the basic construct upon which all other concepts are either build or operate upon. The next concepts it introduces are the “Privacy dilemma” and the Transparency Dilemma”.

Taking these three basic concepts it then builds them into the Privacy-Transparency Pareto frontier which is basically saying privacy and transparency are a ‘ying and yang’ that in varying levels are appropriate to constitute the makeup of an information flow, so in some cases there is no privacy attributes but full transparency while in other cases significant privacy attributes are required and present which limits the availability for aspects of transparency, while lastly there are situations with varying mixes of both privacy and transparency which are appropriate for the existence and use of the information flow.

A key attribute of the privacy/transparency tradeoff can be the multi-objective basis of some information flows, another take on this is that there can be a logical negation effect at play, where a stakeholder is focused on characterizing a situation using one attribute and is wholly focused on that attribute but when viewed from its logical negation the problem and solution are much clearer.

From the field of permaculture design, an crisp example of this type of behavior is as follows — a person complains to a permaculture designer that “their garden is overrun with slugs and they are eating all my vegetables”, where upon the permaculture design responds — ” it is not an excess of slugs that is your problem but a deficiency of ducks to bring your system back into balance”.

Privacy/Transparency Tradeoff.

In the privacy/transparency tradeoff, too much privacy and thinking that locking down data access is the solution to every problem but this can thwart societal benefits because transparency suffers as an example — a crooked politician will want access to data that may show their corruption to be completely made private while having appropriate transparent access benefits society and roots out corruption.

Examples of Information Flows.

The Course continues to provide concrete examples of the dynamics Information flows within:

  • Research and how it can be constrained by having the incorrect privacy/transparency design.
  • Market competitions for information flows.
  • Data, Energy and the Environment and how all these can benefit for better engineering of information flows.
  • Feedback mechanisms and how they interact with and within information flows.
  • and lastly how Democracy and public discourse can be more healthy and positive with appropriate information flows.

As well as discussing information flows and what incentives are appropriate or successful information flows for markets, the course provides concrete examples of safe data networks for business governance and R&D, how does an information flow relate to conflict and political science and the dynamics of good and bad information flow realization for disinformation.

A key tenant of the course is the society runs on information flows and having appropriate and correct information flows is essential and huge positive opportunity for society in general.

Although the information flow seems like a mythical perfect object the course continues to discuss a number of limitations of information flows including:

  • The Copy problem.
  • The Bundling problem.
  • The Recursive Enforcement problem.

Structural Transparency.

After the base concepts, benefits, problems and limitations of information flows had been introduced in the first portion of the course, the second half of the course begins to introduce how to introduce solutions to the privacy/transparency tradeoff where techniques and technologies can allow for enabling desired uses of information without also enabling misuse.

Structural transparency and its 5 components are introduced, these are:

  • Input Privacy.
  • Output Privacy.
  • Input Verification.
  • Output Verification.
  • Flow Governance.

Once the mental framework and associate technology tools of Structural Transparency has been presented, the course finishes with the impact that structured transparency can have across a number of domains including:

  • Academic Research and R&D
  • Consumers and the service providers that serve them.
  • News Media.
  • the growing set of instances of the use of machine learning.
  • Government, Intelligence, Statistics and Regulatory bodies.

In Summary

by undertaking this course, it provided me with:

  • A better understanding of privacy issues and more importantly a better framework to analyze, manipulate, specify and consider solutions within the Privacy AND transparency sphere.
  • A concrete set of examples that drive my understanding and also to educate others on privacy/transparency issues being discussed both as an individual and also in a professional capacity.
  • Insight into emerging tools and technology that will allow for the engineering, creation and modification of key information flows so that there capabilities are more full spectrum rather than being wholly privacy lock downs or near ‘public domain’ or wide open flows to allow for transparency.

In summary, I would wholeheartedly suggest to everybody to invest the time to at a minimum spend some time reviewing or taking this course and if there is more personal or profession interest further engage with the concepts, solutions, supporting technology and the openmined community itself.

Data, Information, Knowledge and Wisdom

Following on from recent posts on the OODA loop and information warfare, lets examine the DIKW Hierarchy a little closer.

DIKW hierarchy adding understanding, and the associated transformations between the levels of the hierarchy.

As noted in Observations on Observability, Metrics are a key source of measurement data and are the base input into the Observe portion of the OODA loop but operating just on data does not lead to significant observability or control over the situation. We continuously hear about big data and interesting, large, complex data sets but in all cases the important focus should be what is done with that data once you have access to it.

The figure above, attempts to depict the nuances of how data in its plainest form is elevated to mythical wisdom.

As show in the figure, Information (another term that is loosely thrown around) is derived from processing data. Information is data with attributes and relationships associated with the data.

A data string of “70,71,63,70,71,72,71” is just a serial string of numbers we can only derive statistical properties such as min, mean, max etc from the numbers and those in itself are pretty boring.

If for instance we added the attributes to this data string of numbers that they are temperature measurements in degrees F and that each entry represents a day of the week starting with Sunday. These attributes immediately change that raw data into information that has more value, we see that they temperatures are pleasant spring or summer temps.

If we not take the information string, and begin to infer or examine it in terms of relationships, an immediate question that comes to mind is what was happening on Tuesday? as the data measurement (63) is not well aligned with the other measurements for the weeks, this inference results in an idea that maybe Tuesday was a cloudy day and that is how that data measurement is lower then the rest.

Wisdom and understanding in this contrived example may be that one knows that, no Tuesday was not a cloudy day. Instead the gardener knocked the waterproof temperature sensor off the ledge where it was sitting into some overgrown plants which had just been watered and were not in the direct sun. When the sensor captured its daily temperature measurement it was not sitting its normal location and for reasons not directly related to weather was 10 degrees F outside expectations. Sometime Tuesday the dislodged sensor was found and returned to its original position and this change of position provides the understanding and intuition (aka Wisdom) for the sensor owner to decide to firmly attach the sensor to its desired position so as to remove these anomalous measurements from the data collection process.

Cyberwarfare: An Introduction to Information-Age Conflict

Cyberwarfare: An Introduction to Information-Age Conflict by Isaac Porche is published by Artech House 2020

Introduction

The book consisting of 13 chapters provides an introductory overview of cyberwarfare as an existing (and new) discipline. Chapter 1 introduces ‘Information and Conflict’ providing key definitions and concepts around:

  • Information
  • Networks and Technology
  • Internet/Web and the information age
  • Characteristics of Cyberspace
  • Security Terminolgy
  • Definitions and descriptions of Cyberspace Operations
  • Electronic Warfare and Spectrum operations
  • Information Warfare
  • Weapons and missions of cyberwar.

DIKW Framework

The DIKW framework is presented which consists of:

  • Data: facts, ideas, metrics, signals that individually exist without explict relationships.
  • Information: Data that has attributes and relationships associated with it — ‘knowing what’
  • Knowledge: Derived inferences from the relationships contained with the Information — ‘knowing how’
  • Wisdom: Advanced knowledge and understanding computed or evaluated from the body of knowledge — ‘knowing why’

This DIKW understanding is interesting both in the context of Information Warfare but I also find it a good framework to apply to personal viewpoints and analysis of Information and Operational Technology (IT and OT).

Lifecycle of cyberattack

In Chapter 2, the author introduces the lifecycle of a cyberattack, speaking of offensive cyber operations and the phases of identification of vulnerability access, gaining and maintaining access through a vulnerability and thirdly using access to deliver and execute a payload.

Power Grid attack surface — Cyberwarfare: An Introduction to Information-Age Conflict
U.S. Department of Homeland Security and U.S. Department of Energy, Energy Sector- Specific Plan: An Annex to the National Infrastructure Protection Plan, 2010, p. 124

Within these attack phases, it should be noted that there is significant planning and preparation effort that is expended prior to the actual intrusion activity.

Cyber Risk

In Chapter 3, the author introduces Cyber Risk and it components (loss probability and the loss consequence)

Risk Assessement, Management, Mitigation and Quantative Analysis of risk are discussed with a final discussion of why risk analysis matters and how one should proceed with dealing with cyber risk.

Risk terms and their relationship — Cyberwarfare: An Introduction to Information-Age Conflict

Legal Aspects of Cyber Warefare

In the next chapter the legal aspects of Cyber Warfare and Information Warfare and introduced with areas including:

  • Overview of the law of armed conflict
  • UN charter
  • Violent act of ware within the context of cyber warfare.
  • Grayzone and Hybrid Warfare.
  • Political norms and Attack attribution.

Chapters 5-9 provides an overview/introduction to:

  • Digital and Wireless Communications
  • Networking
  • Networking Technology including Ethernet, Wifi and bluetooth.
  • The Internet Protocol (IP), Transport Layer protocols and Internet Infrastructure.

These introductions are detailed and should be consumable by a general reader and will be common knowledge to most IT professionals.

Offensive Cyber Operations

Chapter 10 introduces Offensive Cyber operations by state actors providing definitions for strategy, tactics, techniques and procedures used in these operations. Background information is provided on the components that may up critical infrastructure within industry (Oil, Gas, Electrcity, Transport, Health, Water, Manufacturing and Pharmacuuticals) which typical have industrial processes that are driven using Industrial Control Systems (ICS).

ICS operations — Cyberwarfare: An Introduction to Information-Age Conflict

Vulnerabilities, Attacks and Exploits of ICS are explored and the chapter provides a set of case studies that enumerates a number of attacks on ICS systems that are documented and reported in Open Source Intelligence and News sources. The attacked detailed include:

A brief treatment is also provided of some ransomware attacks including:

  • Wannacry.
  • NotPetya.
  • BadRabbit.

In Chapter 11, the author provides a detailed discussion of Tactics, Techniques and Procedures (TTP) for Offensive cyber operations including discussing the process of an expliotation of web applications.

Chapter 12 provides a discussion of cybersecurity in the maratine domain with Chaper 13 discussing cybersecurity in the US elections (2016)

Final Thoughs

Overall, this is a good introductory text on cyberwarfare which although published in 2020 will be in need of an update based on rapid evolution of events that have ocurred in 2020 and 2021, some areas that I believe that may be future subjects for Mr. Porsche to consider are:

  • The Solarwinds compromise, providing a mechanism for exploitation using the tools that IT departments use to operate networks.
  • The Colonial pipeline attack, a ransomware attach that crippled a critical component of the supply chain that affected the East Coast of the US.
  • Other ransomware attacks that have crippled health care operations such as the attack on the HSE in Ireland.
  • Although not a cyberattack, the Even Given/Suez incident and how the worlds supply chain can be disrupted by a single vessel blocking a chokepoint in a global transport network.

The Hilbert Curve in practice

In a previous post, I introduced the concept of space filling curves and the ability to take a high dimension space and reduce it to a low or 1 dimension space. I also showed the complexity in 2 dimensions and in 3 dimensions of the Hilbert Curve which I hope also provided an appreciation for the ability of the curve to traverse the higher dimension space.

In practice there are a number of implementations of the Hilbert curve mapping available in a number of languages including:

From galtay we have the following example where the simplest 1st order 2 dimension hilbert curve maps 4 integers [1,2,3,4] onto the 2 dimensional space <x,y> x = (0|1), y = (0|1)

>>> from hilbertcurve.hilbertcurve import HilbertCurve
>>> p=1; n=2
>>> hilbert_curve = HilbertCurve(p, n)
>>> distances = list(range(4))
>>> points = hilbert_curve.points_from_distances(distances)
>>> for point, dist in zip(points, distances):
>>>     print(f'point(h={dist}) = {point}')

point(h=0) = [0, 0]
point(h=1) = [0, 1]
point(h=2) = [1, 1]
point(h=3) = [1, 0]

its also possible to query the reverse transformation going from a point in the space to a distance along the curve.

>>> points = [[0,0], [0,1], [1,1], [1,0]]
>>> distances = hilbert_curve.distances_from_points(points)
>>> for point, dist in zip(points, distances):
>>>     print(f'distance(x={point}) = {dist}')

distance(x=[0, 0]) = 0
distance(x=[0, 1]) = 1
distance(x=[1, 1]) = 2
distance(x=[1, 0]) = 3

On galtay’s repositary, there is a graphic that shows 1st order, 2nd order and 3rd order curves in an <x,y> space. The ranges represented by each of the curve get more resolution as the order increases:

  • 1st order curve supports values (0|1) on the x and y axis giving us a 2 bit binary number of range values i.e. 00, 01, 10,11 -> 0..3
  • the 2nd order curve is more complex and (0|1|2|3) on the x and y axis giving us a 4 bit number of range values, 0000, 0001 0010….1111 -> 0..15
  • the 3rd curve includes the x,y values to 6 bits of resultion giving values 0->63.

As I have noted, an increase in the order of the curve, increases it complexity ( wiggleness) and its space covering measure and also provides more range quanta along the curve.

Returning to my suggestion in the earlier post, that the curve can be used to map a geographic space into the range and then have a entity (ip addresses which by themselves have no geographic relationship mapped not onto the range. in this fashion, subtraction along the range provides a (resolution dependant) measure of closeness of the location of these ip addresses.

galley rendering of a 3rd order hilbert curve in black

Using galtay rendering of the 3 order curve shown in back, if one focuses on the value 8 along the curve, its specially close in 2 dimensions 13,12,11,10,9,7,6,2 but not specially close to 63 or 42 which are rendered outside the area shown. With simple subtraction we see can have rule that says ip addresses within 5/6 units the 8 are close to whereas ip addresses with 20, 30,40 units distance are further away. As the order of the curve increases, this measurement get a better resolution.